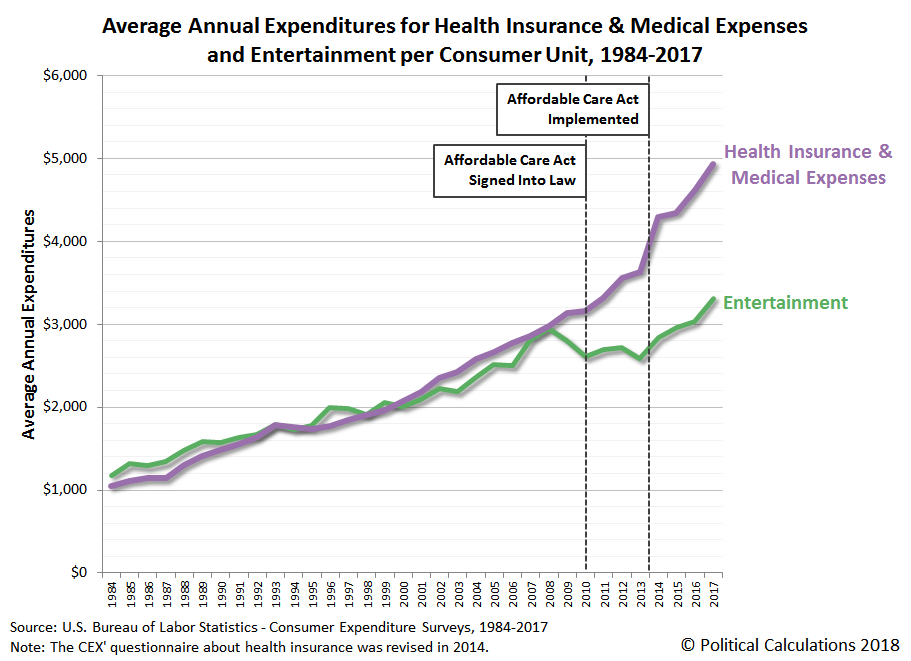
When we first visualized the long-term trends for American household spending through 2017, we couldn't help but notice how similar the trends were for the expenditures on Entertainment and on Health Insurance & Medical Expenses over much of that period, or really, from 1984 through 2008, after which, they diverged. The following chart zeroes in on the average annual expenditures that an estimated 130,001,000 American household "consumer units" spent on these two major categories from 1984 through 2017, where we've identified the primary contributing factor to that outcome.
In the next chart, we look at the same expenditures as a percentage of the total annual average expenditures of an American household consumer unit, this time, without the annotations identifying the Affordable Care Act as the primary contributor to the escalation in health care costs that caused the two household expenditures to diverge.

In the third chart, we drilled down into the subcategories of health care expenditures to break out the average amount that American household consumer units have spent on health insurance, medical services, medical supplies, and drugs to see how they've changed after 2008, which is when one or more of these expenses began to explode.

Wasn't the Affordable Care Act supposed to bend the cost curve for health insurance in the other direction?
Clearly, that didn't happen, where we find the cost of health insurance has continued to grow at similar rates after spiking in 2014 with the 2013 implementation of the Affordable Care Act (while implemented in 2013, much of the increased cost associated with the ACA began to be incurred by U.S. households in 2014). Here's a neat chart that accompanied a September 2017 Motley Fool article showing what has happened to the average cost of health insurance coverage for American families from 2008 through 2017:

The important thing to recognize about all this data on the runaway cost of health insurance being paid by American households since the Affordable Care Act was signed into law and especially since it was implemented is that it is entirely attributable to actions taken by President Obama while in office for his signature domestic policy "achievement", which also encompassed the setting of health insurance 2017's premiums and deductibles, and also the Affordable Care Act's main enrollment period for that upcoming year.
If President Trump has done anything to influence health insurance costs, it hasn't shown up in any of this data yet. We'll have to wait to September 2019 when the results of the Consumer Expenditure Survey for 2018 become available to find out what that may be!
Data Sources
U.S. Bureau of Labor Statistics and U.S. Census Bureau. Consumer Expenditure Survey. Multiyear Tables. [PDF Documents: 1984-1991, 1992-1999, 2000-2005, 2006-2012, 2013-2017]. Reference Directory: https://www.bls.gov/cex/csxmulti.htm. Accessed 11 September 2018.
